Policy Question – Parking Structures
Could some planned or proposed parking structures be downsized through pricing and provision of other modes without negative impacts on transit ridership/revenues and downtown retail?
Question Purpose
What is the purpose of this question, why is it important, and who is the intended audience?
This question will provide MTC, transit agencies, and cities with information that would allow for better investment of funds through more cost conscious and appropriate sizing of parking structures; it will also give support for cost effective investments into alternative modes. Altogether, this question is intended to explore policies that will better utilize limited transportation funds, make better use of existing parking supplies, and encourage alternative travel modes in order to reduce the oversupply of underpriced parking spaces in future developments.
Overview of Analysis
How is this question being addressed? What approach is best, given limitations?
This question is being addressed through a review of existing papers and an analysis of policy applications and related studies and supplemented with regional Travel Model One analysis. [1] In the abstract, this question would be answered by analyzing each case individually, assessing the need, cost, transit service and other alternative mode access to each site where parking structures are planned or proposed.
In addition to a review of best practice research and analysis methods, the Bay Area’s Travel Model One was used to look at how eliminated parking as well as increased housing affects BART ridership.
Background & Research
Literature Review:
Best Practice: Pricing Parking near Transit Stations
In theory, pricing of parking at transit stations where the parking is regularly used to full capacity could lead to increased transit ridership, through a couple processes. First, priced parking results in some local residents who otherwise drive to instead choose to walk, bicycle or take transit to a close station. Second, some riders from farther away will carpool to minimize their parking expense. In both cases this frees up the station parking for others who drive and park, some of whom were not taking transit previously due to the lack of parking availability. However, there has been only limited research to determine the size of this effect.
Replacing Parking with TOD

Figure 4: TOD example Image: ucsc.edu
Several studies have looked at mode share in housing adjacent to transit stations. Lund, Cervero, and Willson (2004) find that residents living near transit stations are approximately five times more likely to travel to work via transit relative to an average resident in that city. However, this amount varies greatly by city and region. This study (Lund, Cervero, and Willson, 2004) found that about 19% of trips by residents near Pleasant Hill BART took transit and 27% of trips by residents (N=176) near Alameda County BART stations took transit (N=177).
The Effects of TOD on Housing, Parking and Travel (TCRP Report 128, Arrington & Cervero, 2008) states that TOD commuters are two to five times as likely to use transit modes. The authors found that the primary reason for this higher percentages in self-selection, where residents chose to live nearby transit due to their preferred access mode.
Fehr & Peers (2006) conducted a study of average household BART mode share and distance from station and found that residents within ½ mile from BART stations average a 16.4% BART mode share.[2] A study by Cervero (1993) found that residents adjacent to BART stations averaged 26.8% rail mode split (sites within 2/3 mile of BART station).[3]
Table 8: Summary of Mode Share by Station-area Residents
| Study | Year | Summary |
| Lund, Cervero, and Willson | 2004 | Station-area residents are 5 times more likely to take transit
(1) Pleasant Hill BART station residents surveyed have a 19.2% mode share. (2) South Alameda County BART station residents surveyed have a 27.4% mode share. |
| Arrington & Cervero | 2008 | TOD commuters are two to five times more likely to use transit modes |
| Fehr & Peers | 2006 | Residents within ½ mile from BART stations average a 16.4% BART mode share. |
| Cervero | 1993 | Residents adjacent to BART stations averaged 26.8% rail mode split. |
BART TOD and Replacement Parking Policies
In 2005, BART developed a modeling tool to evaluate replacement parking when new development impacts existing parking facilities around BART Stations. BART previously had a one-to-one parking replacement requirement, but came to realize that this policy was discouraging transit-oriented development around stations. This model looks at each scenario specifically, evaluating current conditions as well as future scenarios and visions for growth. Shared parking, pricing, or other supply and demand management policies are evaluated and incorporated into the planning process to determine how a replacement parking strategy should progress. However, the model does not consider regional-scale effects and instead takes a local approach by not incorporating system-wide parking supply and demand. In addition, BART now uses a corridor approach which identifies different roles for different stations along a line, identifying certain stations as key TOD opportunity sites and shifting parking demand to other stations.
Replacement Parking at VTA Light Rail Stations
Santa Clara Valley Transit Authority (VTA) evaluated how much parking should be replaced to accommodate proposed TOD development at 13 light rail stations in San Jose. This evaluation included various policy strategies to reduce parking demand, encouraging diverse station areas that are not automobile-oriented. After determining which stations do not have enough parking capacity to accommodate estimated future use at these free lots, VTA determined alternative methods to accommodate the projected demand. Rather than constructing additional parking facilities (a very high-cost option), VTA decided to (1) reduce parking demand by improving alternative-mode access and implementing Travel Demand Management (TDM) policies, and (2) implement shared parking with adjacent land uses that have unused parking during commute hours. In addition to balancing supply and demand, these policies aligned with the agency’s TOD program goals.
Best Practice: Parking Structure Analysis
MTC’s Parking Structure Technical Report (Nelson\Nygaard and Dyett and Bhatia, 2011) describes the opportunities and challenges that are related to parking structures. While parking structures can benefit a community in several ways, challenges with parking structures include (1) not enough demand to support the need for a structure, (2) high monetary, environmental, and opportunity costs, and (3) impacts to the community with design, circulation, and safety concerns. The purpose of this report is to provide guidance on fully evaluating the need for parking structures—a multimillion dollar investment—before the investment is made. In addition to providing a 6-step evaluation framework, this report highlights three case studies where parking has been successfully reevaluated:
”Right Sizing” Parking (MTC)
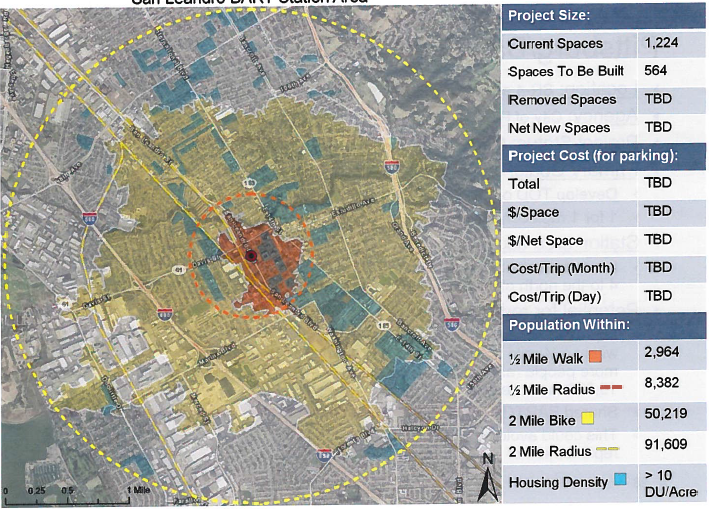
A 2012 report addresses characteristics of proposed new parking structures serving transit in the Bay Area. This study looks in depth at 19 parking structures that are planned or in progress and describes the net cost per new parking space, amount and source of funding, the purpose, and the potential for reduced parking. It applies network analyst to highlight the difference between theoretical access and actual access for nearby populations within 10 minutes through for bicycle and walk modes, suggesting the potential for specific infrastructure improvements to capture more riders through these modes. Opportunities for reduced parking, such as shared parking or nearby available parking supply are identified. For example, the study identifies an opportunity for the San Leandro Boulevard structure to increase bicycle/pedestrian access as a demand management strategy (Figure 5).
Figure 5: Station-area Analysis from MTC’s “Right Sizing” Parking Report (2012).
Petaluma Station Area Plan Parking Policies
In 2012, Petaluma conducted station area plans for two SMART rail stations within the City that are slated for TOD developments for horizon year 2035. The evaluation showed that additional parking would be unnecessary, as current supplies were greater than the projected parking demand. The study resulted in several key findings, including:
- Opportunities to manage park-and-ride demand and increase transit-oriented development will potentially allow the initial parking supply to be replaced with new development and shared parking.
- Parking structures would be a significant cost-factor as well as a potential barrier against maximizing the value of the land.
- Rail and transit served locations will have lower parking requirements than conventional suburban parking ratios, provided that a parking management plan is in place.
- Shared parking, flexible use of supply, Transportation Demand Management plans, pricing, and Parking Benefit Districts were all recommended to manage the supply and demand of SMART Station Areas.
Best Practice: Economic Assessment of Parking at Transit Stations
When the cost and ridership impacts of parking is compared to TOD development around suburban BART stations, a study funded by MTC (Wilbur Smith Associates, 2011) found that ridership generated by BART parking could be achieved with housing around stations instead of parking, and would generate more revenues for BART.[4] Even near suburban stations (assuming that 25-35% of total trips are via BART for households around stations), higher density housing can be competitive with parking lots in terms of generating riders. Additionally, analysis of parking costs and pricing showed that station parking lots are significantly underpriced, given the value of the station-area land as well as the cost of constructing the parking. Parking fees would need to be increased two to four times their current levels at BART lots and structures in order for BART to break even.
Best Practice: VTPI’s Parking Costs, Pricing and Revenue Calculator
The Victoria Transport Policy Institute (www.vtpi.org) has created a spreadsheet tool to calculate the estimated costs for parking facilities, recovery pricing, and revenue generation. This tool is useful for estimating how much a new parking facility would cost to construct and operate; estimating the prices that a facility should charge to recover construction and operating costs; and estimating revenues and profits that are generated from charging various prices. This calculator is valuable in its inclusion of different land use types (suburban, urban, and central business district) and its ability to input more context-specific values—such as the cost of land and interest rates—if necessary. However, it is a cost-revenue analysis and does not include any user choice, supply, or demand information.[5]
Policy Application: Union City Park & Ride Pricing and Downsizing
In 2007, the City of Union City began Phase I of the Intermodal Station project, improving multi-modal station access as part of an effort to adapt the area for future TOD. This effort included improving bicycle, pedestrian, and transit facilities around the BART station and parking lot. Due to a high demand for parking, this effort was conducted to manage demand and avoid the expense of constructing a new parking facility. To encourage TOD development instead of increasing parking supply, the City began implementing paid parking in April 2010 by installing pay-stations throughout their on-street and off-street parking. They have priced their off-street city-owned lots adjacent to the BART station at $3/day or $0.50 per hour.
Before pricing implementation, BART station commuters were parking on-street all day and the lots were full; Union City’s pricing strategy was successful in both reducing spillover into on-street spaces and also reducing overall parking demand. Analysis of ridership was conducted after parking pricing was implemented with pay-stations; the number of BART commuters did not decrease after the 2009 introduction, yet use of the parking lot decreased, suggesting that users switched to other modes. Now the City experiences approximately $450,000 in net revenues from parking per year. Additionally, the City experienced “almost no public outcry” after implementing the paid parking program.[6]
Best Practice: Shared Parking
Shared parking—where a single parking lot is used by multiple businesses or organizations—allows off-street resources to be used more efficiently. Often, shared parking can be used as a tool to reduce the number of total parking spaces used; MTC’s “Right Sizing Parking” (2012), identifies many opportunities for planned or proposed parking structures in the Bay Area to be reduced by implementing shared parking. Shared parking makes use of the fact that nearby businesses often have different peak-periods throughout the day—such as a restaurant and a doctor’s office—and also makes use of the fact that many parking facilities have a large portion of unused space during the off-peak periods. Shared parking often reduces the total amount of parking an area uses by 40-60%, reducing the land devoted to parking and therefore potentially improving pedestrian connections between businesses.
Shared parking between different sites can be negotiated by contractual agreements between nearby businesses that have different peak demand times. They can also be organized by parking management districts or BIDs. With both methods, businesses can overlap their parking capacity during these times and reduce the number of spaces that the combined business would otherwise require. Local municipalities can help facilitate shared agreements with private businesses with off-street parking with agreements and legal documentation that may be needed to allow access to other private entities. As a modest approach, local jurisdictions can modify their parking requirements to allow shared parking to count toward satisfaction of the city parking requirements.
Best Practice: Valet & Off-Site Parking
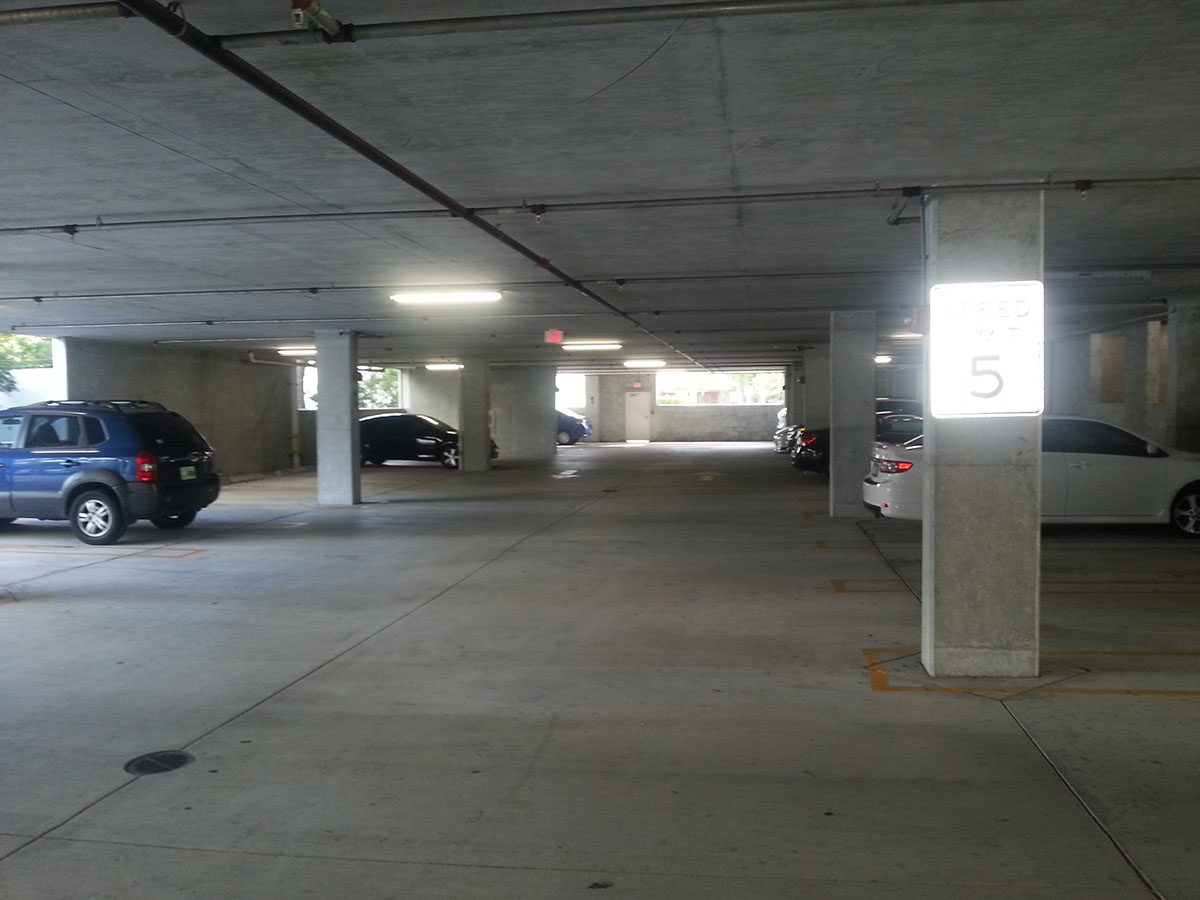
Figure 6: Empty parking structure that could be used for valet parking
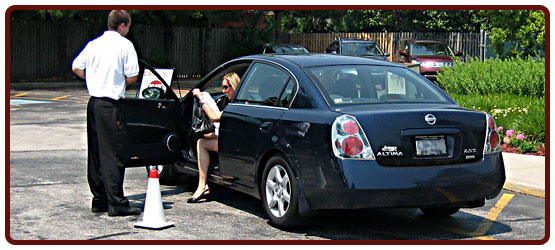
Figure 7: Off-site valet parking option Image: Medparkcorp.com
Rather than constructing parking on high-value land within mixed-use and commercial areas, lower-value adjacent parking may be available for valet parking. This is especially valuable in avoiding the construction of new facilities where there is underutilized parking supply nearby. Valet parking can be used to reduce the amount of space devoted to parking in pedestrian-friendly retail corridors and also reduce vehicle congestion from cars circling to find parking. This can also expand the supply of parking that is convenient in the most popular commercial areas during the peak period. In many areas, parking is built to accommodate the peak period(s) of the week or year, but is not used for the remainder of the time. In these cases, utilizing off-site lots in areas with different levels of demand for the time of day or week will help provide parking, at a much lower cost than building and maintaining new facilities. For example, parking structures that are primarily used for employees during regular business hours are often severely underutilized during other times of the day and week, and can serve as capacity for entertainment uses that have high demand during the evening period. Private businesses or commercial parking lots can also include valet parking attendants to park vehicles during especially busy periods. Litman (2006) estimates that valet parking can increase parking capacity by 20-40% compared with users parking their own vehicles.
An alternative to valet parking is providing shuttle service for those parking to ride in on from a satellite (off-site) parking lot. Like valet parking services, off-street capacity can help reduce traffic in pedestrian retail centers. Like valet services, a shuttle service could be used to supplement parking supplies only during the times of peak demand. If shuttle service was from a shared parking lot with a complementary demand period to create the commuter lot, it would eliminate the need to expand overall parking supply.
Policy Application: Valet Parking in Redwood City
To accommodate high demand at discrete time periods, Redwood City initiated a valet parking program to take advantage of underutilized parking supplies that were located outside of the highly-demanded downtown area.[7] Parking supply was adequate to serve patrons during most of the week, but was constrained during the peak period. If a new parking structure was constructed, it would have been underutilized for most time periods, and likely would have required substantial on-going subsidies. So instead of constructing new supplies within the downtown, Valet parkers make use of the underutilized parking supplies that were only a quick drive outside of the downtown area, without the inconvenient of parking farther away for patrons. The Redwood City Pilot Valet Parking Program was an effort spearheaded by a local theater owner, in response to overwhelming parking demand in the downtown area during weekend evenings.
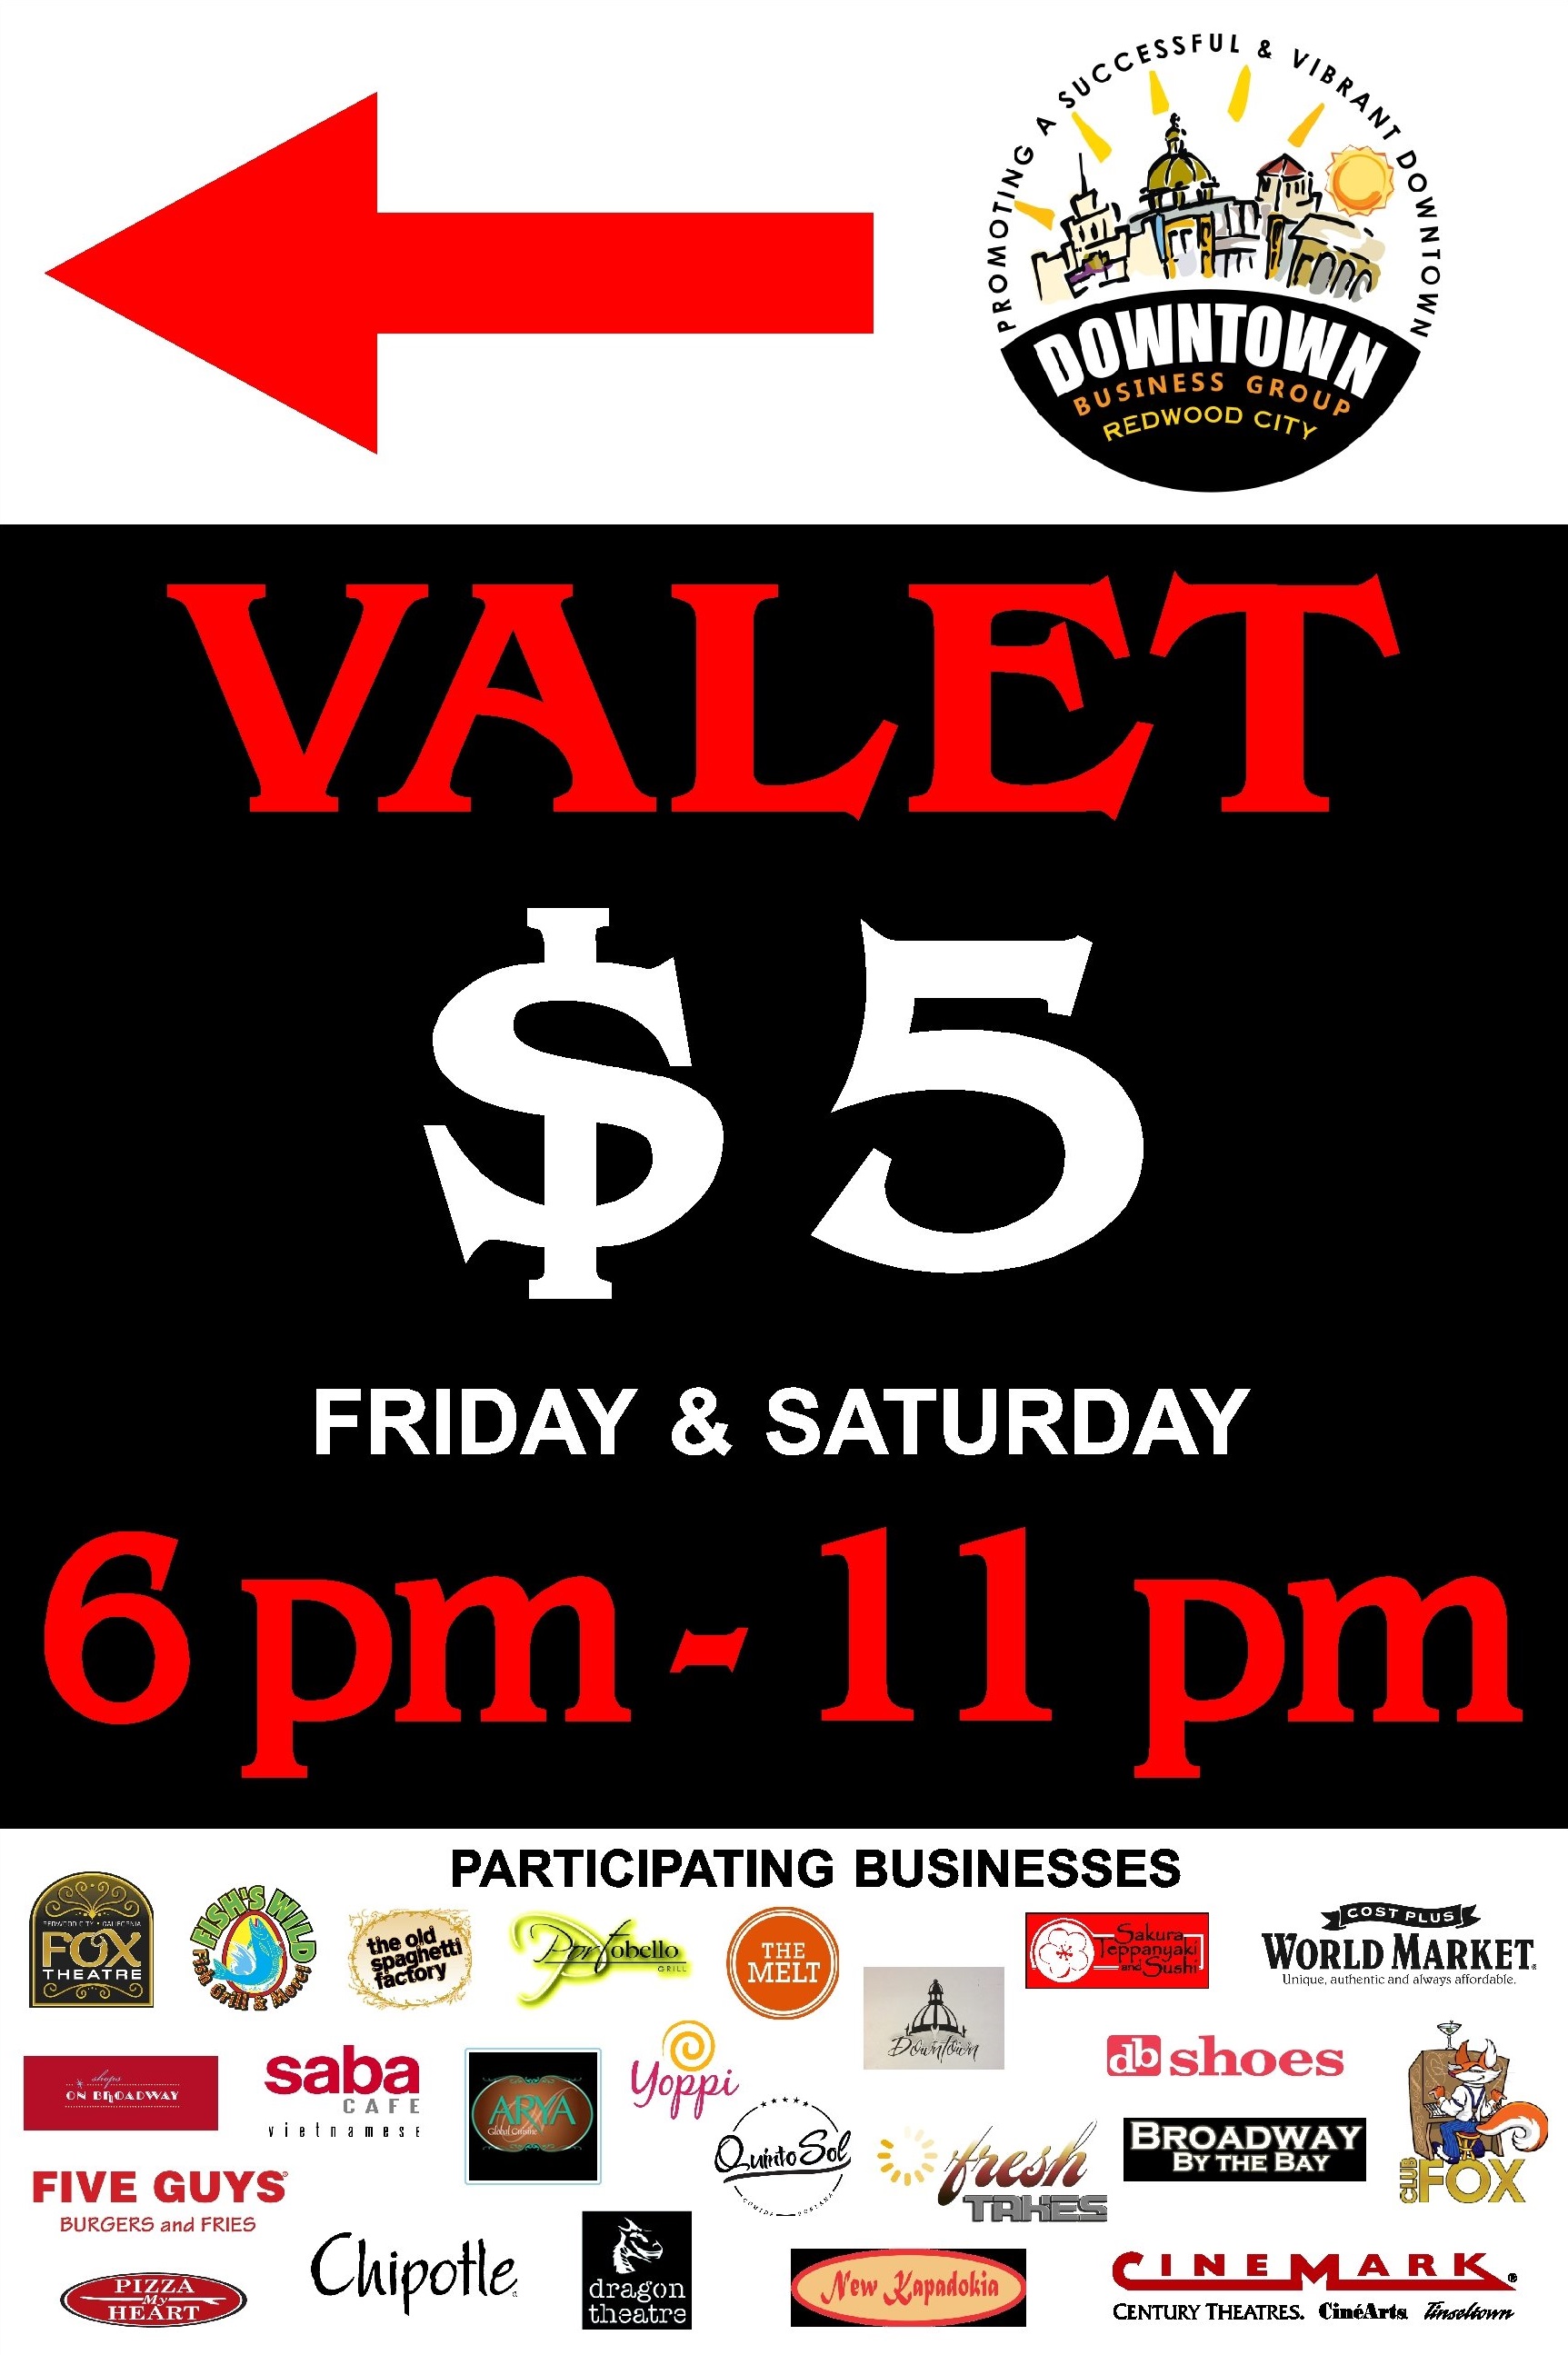
Figure 8: Redwood City Valet Poster Image: City of Redwood City
In order to get the service started, the business owner worked with City of Redwood City, fellow businesses, and the Downtown Business Association. The program started with a Pilot Valet Program, working with businesses to establish drop off zones and off-site parking lot locations. As of late 2013, the program was proving successful and planning to expand. While the valet program was open to all Downtown patrons, the patrons of member businesses received $5 discount validation for the program. This approach encouraged greater participation from downtown businesses.
Best Practice: Using Taxes to Affect Private Parking Usage
As implemented successfully by the City of Union City, pricing can be a strong tool to manage parking usage and reduce the construction of new parking structures. However, private parking is more difficult to manage directly by public agencies. However, there are many ways off-street private parking can be managed. Local governments can control off-street garage prices with increased taxes, which are typically passed on to the garage user in the form of increased parking rates. San Francisco taxes all off-street parking spaces at a rate of 25% of the total parking charges. These taxes are common throughout the U.S.; the Baltimore Parking Authority, for example, collects a higher tax for parking facility transactions in order to increase the user’s cost equivalent to $14 per month.[8] The highest parking tax in the country is in Pittsburgh, PA, at 40% of the total parking charges.[9]
Travel Model One Analysis
Modeling Overview
While Policy Question #5 is not fully addressed via modeling methods, this question is partially addressed through MTC’s regional travel demand model, Travel Model One (TMO). The analysis of model scenarios specifically focuses on how pricing fees at Bay Area Rapid Transit (BART) parking facilities can affect the demand for parking and transit mode share. Additional factors analyzed include vehicle ownership, trip costs, and BART ridership. Some restrictions on the modeling include:
- Vehicle-access to stations does not distinguish between single-occupancy vehicles, carpools/rideshares, and kiss-and-ride (passengers getting dropping off at stations).
- Impact on retail and other land uses is not included in the model.
- Parking within model is limited to a Yes/No analysis; the number of parking spaces at each station is not defined.
- Government-set on-street parking prices and market-driven private off-street lot prices are not distinguished.
Several steps were taken to set up the model and establish the scenarios to be analyzed. First, in order to focus the analysis, a few select stations were chosen. Nine BART stations chosen for the TMO analysis were evaluated based on a qualitative analysis of the UrbanSim regional model’s results was conducted to select a set of stations where it would be feasible to develop TOD in place of parking facilities.[10] While all stations will be evaluated in terms of impact, the stations where daily fee changes are being implemented include: Ashby, Bay Fair, Coliseum/Oakland Airport, El Cerrito Plaza, Glen Park, Lafayette, Lake Merritt, North Berkeley, Orinda, San Leandro, and West Oakland.[11]
The parking costs per station are added to TMO to create a baseline comparison that includes current parking costs. The cost of parking and users willingness-to-pay was evaluated to establish scenarios based on additional parking fee amounts. Last, the MacArthur BART station development was used as a model to estimate additional housing development if the land currently used for parking were instead used for housing. The residential TOD estimates assume the same density of housing as the MacArthur Transit Village Parcel D in Oakland, CA. This development of 5-stories, consisting of 90 units of affordable family housing on 0.78 acres including 2 studios, 22 one-bedroom, 29 two-bedroom, and 37 three-bedroom units (density of 115 du/acre).
Altogether, the analysis of these factors led to the development of four scenarios to evaluate.
Travel Model One Scenarios & Results
Three scenarios were modeled and compared for this analysis: (1) baseline scenario with “no change” conditions, (2) a no-parking scenario with all drive access removed at stations, and (3) a housing scenario with housing built at each station. The amount of housing built is assumed to equal the approximate acreage of current BART parking facilities. Scenario 4 was created by combing a no-parking scenario with a housing scenario—therefore, parking is removed, but housing is added. These scenarios are built in order to estimate the effect of replacing parking with housing.
Table 9: Travel Model One Scenarios and Results
| Scenario 1: Baseline (no change) | Scenario 2: Removing drive access | Scenario 3: Adding housing at each station | Scenario 4: Replacing parking with housing | |
| Ridership | 325,710 | 314,695 | 331,415 | 320,400 |
| Change from baseline | +0 | -11,015 | +5,705 | -5,310 |
Travel Model One Summary & Discussion
Transit-oriented development (TOD) expanded past just the BART station facility parking as well as generating additional commercial and office land uses is likely to generate more demand relative to parking. The Travel Model One results shows that while parking alone will provide more ridership, replacing parking with housing makes up approximately one-half of that decrease with merely the 1-to-1 replacement of parking and housing. Additional TOD development adjacent to a parking lot would not only bring more ridership from residents, but also increase office and commercial use as well.
Additional benefits of more station access trips being generated by non-drive modes would also be provided. Without the option to drive, a portion of patrons who previous accessed the station by single-occupancy vehicle would likely take alternative modes.
An additional factor when considering TOD replacement of commuter parking lots at BART stations is BART capacity. TOD development generates more off-peak ridership, shifting demand towards other periods of the day. As BART ridership demand continues to increase while capacity is constrained in the near-term, this could help manage demand as well as increase development of more commuter transportation options, such as transbay bus systems, carpooling, and Bus Rapid Transit.
Cities and transit agencies should consider the benefits of providing TOD development in the place of parking near BART stations. The ridership generated from housing alone replacing the parking lot space is shown to already be half the total ridership gained from the parking facilities. If development demand is higher, providing TOD land uses will (1) encourage development in transit-accessible areas, and (2) generate further demand for more development surrounding stations.
Challenges
What (if any) impediments inhibit our ability to answer the question entirely?
It is difficult to apply the same analysis to all parking structures and all areas due to varying land use contexts. Additional work is needed on developing an approach or methodology for evaluating the level of parking and the pricing policies that are effective for different types of land uses in each of the place types. The challenge is to create theoretically robust and operationally effective analytical and policy tools that can be applied to add value in different situations.
The challenges with analyzing the effects of removing parking, pricing parking, building a structure and/or adding TOD is very difficult to do in any model. Many factors are very difficult to predict given limited data and forecasting of the model:
- If parking were removed, would some demand be accommodated with private commuter lots or nearby on-street parking?
- To what extent would TOD development spur a vibrant transit neighborhood, improving businesses revenues as well as increasing development for restaurants, retail, and other commercial uses?
- How many residents who previous drove to the station would switch to alternative modes to access the station?
- How would additional amenities and services, such as increased bus access and improved bicycle access, as well as decreased convenience of driving to the station increase non-automobile access?
Question such as these are context-specific, dependent on many factors and would vary from station-to-station. Previous research highlighted below can help us predict changes, and TMO can look at high-level shifts, but these questions are based on factors such as demographics, land use, timing, as well as planning and implementation.
Potential Policy Actions
Local jurisdictions should consider study area vision when deciding to increase parking supply, looking at demand management including multi-modal access to serve residents and manage traffic. Regional policy actions include requiring appropriate planning and financial analysis prior to any regional funding of parking structures, including for Regional Measure 3 (RM3) funding. In evaluating the need for parking structures, local jurisdictions should be sure to analyze financials to evaluate the cost of providing parking, willingness of public to pay at rate that does not require a subsidy, and alternatives to providing additional supply that may bring more benefit to local residents and businesses.
MTC should require a robust analysis of proposed parking structures that includes parking demand and multi-modal access to the service area as well as financial proforma of the proposed facility prior to MTC contribution of regional funds.
Additional Information
The true-cost of parking is never truly evaluated as a stand-alone item from the buyers perspective (person buying the home/condo/etc) as the purchase price of a home normally includes a bundled price for the home and garage. However, from a developers perspective, the cost of parking is always considered during the planning of a project because of stringent parking demands and their high cost to build. The following are supplemental articles from around the country that seek to expand the public’s knowledge of actual parking costs associated with development projects. The King County Residential Parking Calculator goes even further by calculating the environmental costs associated with parking. The intent is to make readers aware of the true cost of parking, its effects on building costs, and its effects on what you the consumer pay through rent or mortgage.
Rightsizeparking.org. (2015). King County Multi-Family Residential Parking Calculator. http://www.rightsizeparking.org/
Jaffe, E. (2015, May 11). The High Cost of Residential Parking. City Lab. http://www.citylab.com/cityfixer/2015/05/how-parking-keeps-your-rent-too-damn-high-in-2-charts/392894/
[1] Recommendations within the MTC’s Parking Structure Technical Report (Nelson\Nygaard and Dyett and Bhatia, 2011) provides further guidelines for a parking structure analysis toolkit, as detailed on page 5-10.
[2] For home-based work and home-based other trips. Source: Parking vs. TOD: A Transit Provider’s Perspective. Fehr & Peers (2006).
[3] Cervero (1993). Ridership Impacts of Transit-Focused Development in California
[4] Wilbur Smiths Associates report for MTC Smart Parking Training, 2011. Parking 201: Economic Assessment of Structured Parking at Transit Stations.
[5] Litman, Todd (2013). Transportation Cost and Benefit Analysis II – Parking Costs. Documentation available at: http://www.vtpi.org/tca/tca0504.pdf
[6] Personal Communication, Mark Evanoff, City of Union City, October 2013.
[7] The initial valet pilot began in a private leased lot (County History Museum) and expanded to the public Marshall garage.
[8] http://www.dot.wisconsin.gov/localgov/docs/smart-growth-parking.pdf
[9] http://www.spur.org/publications/article/2008-09-01/more-work-less-waste
[10] UrbanSim. The results analyzed assumes that the region largely evolves along the line envisioned by the Metropolitan Transportation Commission’s (MTC) Preferred Plan. The Preferred Plan referred to the Jobs-Housing Connection Strategy of Plan Bay Area. BART station parking lot acreage is estimated based on count of parking spaces (BART, 2013), assuming 125 spaces/acre
[11] In order to focus on a select few stations, this analysis was limited to East Bay BART stations.
