Overview – Supply & Demand
Where is local parking supply greater than demand, and where is local demand greater than supply, and at what prices for parking does this hold? Does this vary systematically by type of place or other criteria?
Question Purpose
What is the purpose of this question, why is it important, and who is the intended audience?
This is a fundamental question that addresses the relationship between parking supply, demand, and pricing. This question is of prime interest to MTC and ABAG. Local jurisdictions are primarily interested in the answers to these questions within their own jurisdictions. This question is especially dependent on parking economics. Each specific location will have its own balance of supply, demand, and price elasticity that will determine how a set price affects the relationship between supply and demand. Factors affect supply and demand are location-dependent—including demographics, transportation options in the area, local and regional policies, as well as culture. Figure 1 illustrates the relationships between parking demand, supply and price.
Figure 1: Relationship between parking demand, supply and price
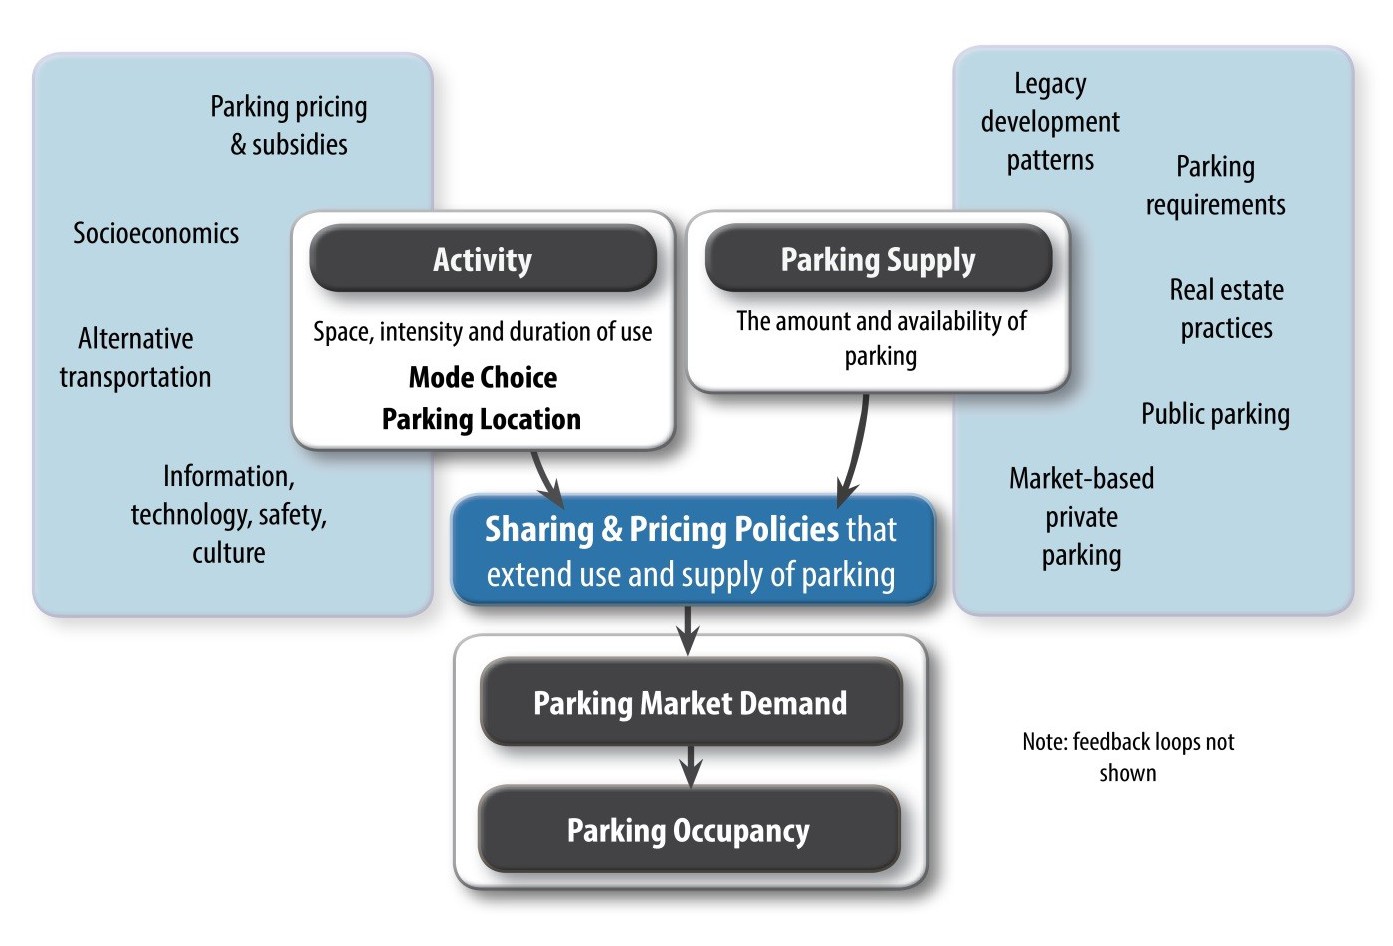
Source: Concept and information from Richard Willson; adapted and edited by CDM Smith, February 2014.
Data analysis methods for this question can be used by local jurisdictions for development of strategies, to begin larger discussions on parking management, or as a starting point for a larger study. Supply and occupancy data can establish a baseline for comparative analysis, allowing local jurisdictions to evaluate how the relationship between parking supply, demand, and price in their jurisdiction compares to the larger region.
Overview of Analysis
How is this question being addressed? What approach is best, given limitations?
In the abstract, we would address this question by analyzing a complete data set of parking inventory, occupancy, turnover, and pricing throughout the region and for all times of day, days of week, and seasons. Information for all parking—both private and public supplies—would allow a full supply and demand analysis. Additionally, before and after data showing user responses to parking price changes would make it possible to calculate the price elasticity of demand, which would allow the project to determine what price could be charged for parking in order to achieve desired occupancy levels.
In this study, this question is addressed primarily through new analysis of new data collected on supply, occupancy, and price of public parking facilities for 25 locations throughout the Bay Area.[1] This information is location-specific so that demand by area is correlated with a high-level summary of the policy, demographic, transit service and/or land use characteristics that makes each area unique. In addition to analyzing occupancy by region, GIS is used to map findings spatially and look at which parking conditions are common throughout the Bay Area (Figure 2).
Figure 2: Example of a parking study in the City of Santa Rosa looking at the balance of supply and demand on a weekday at noontime.
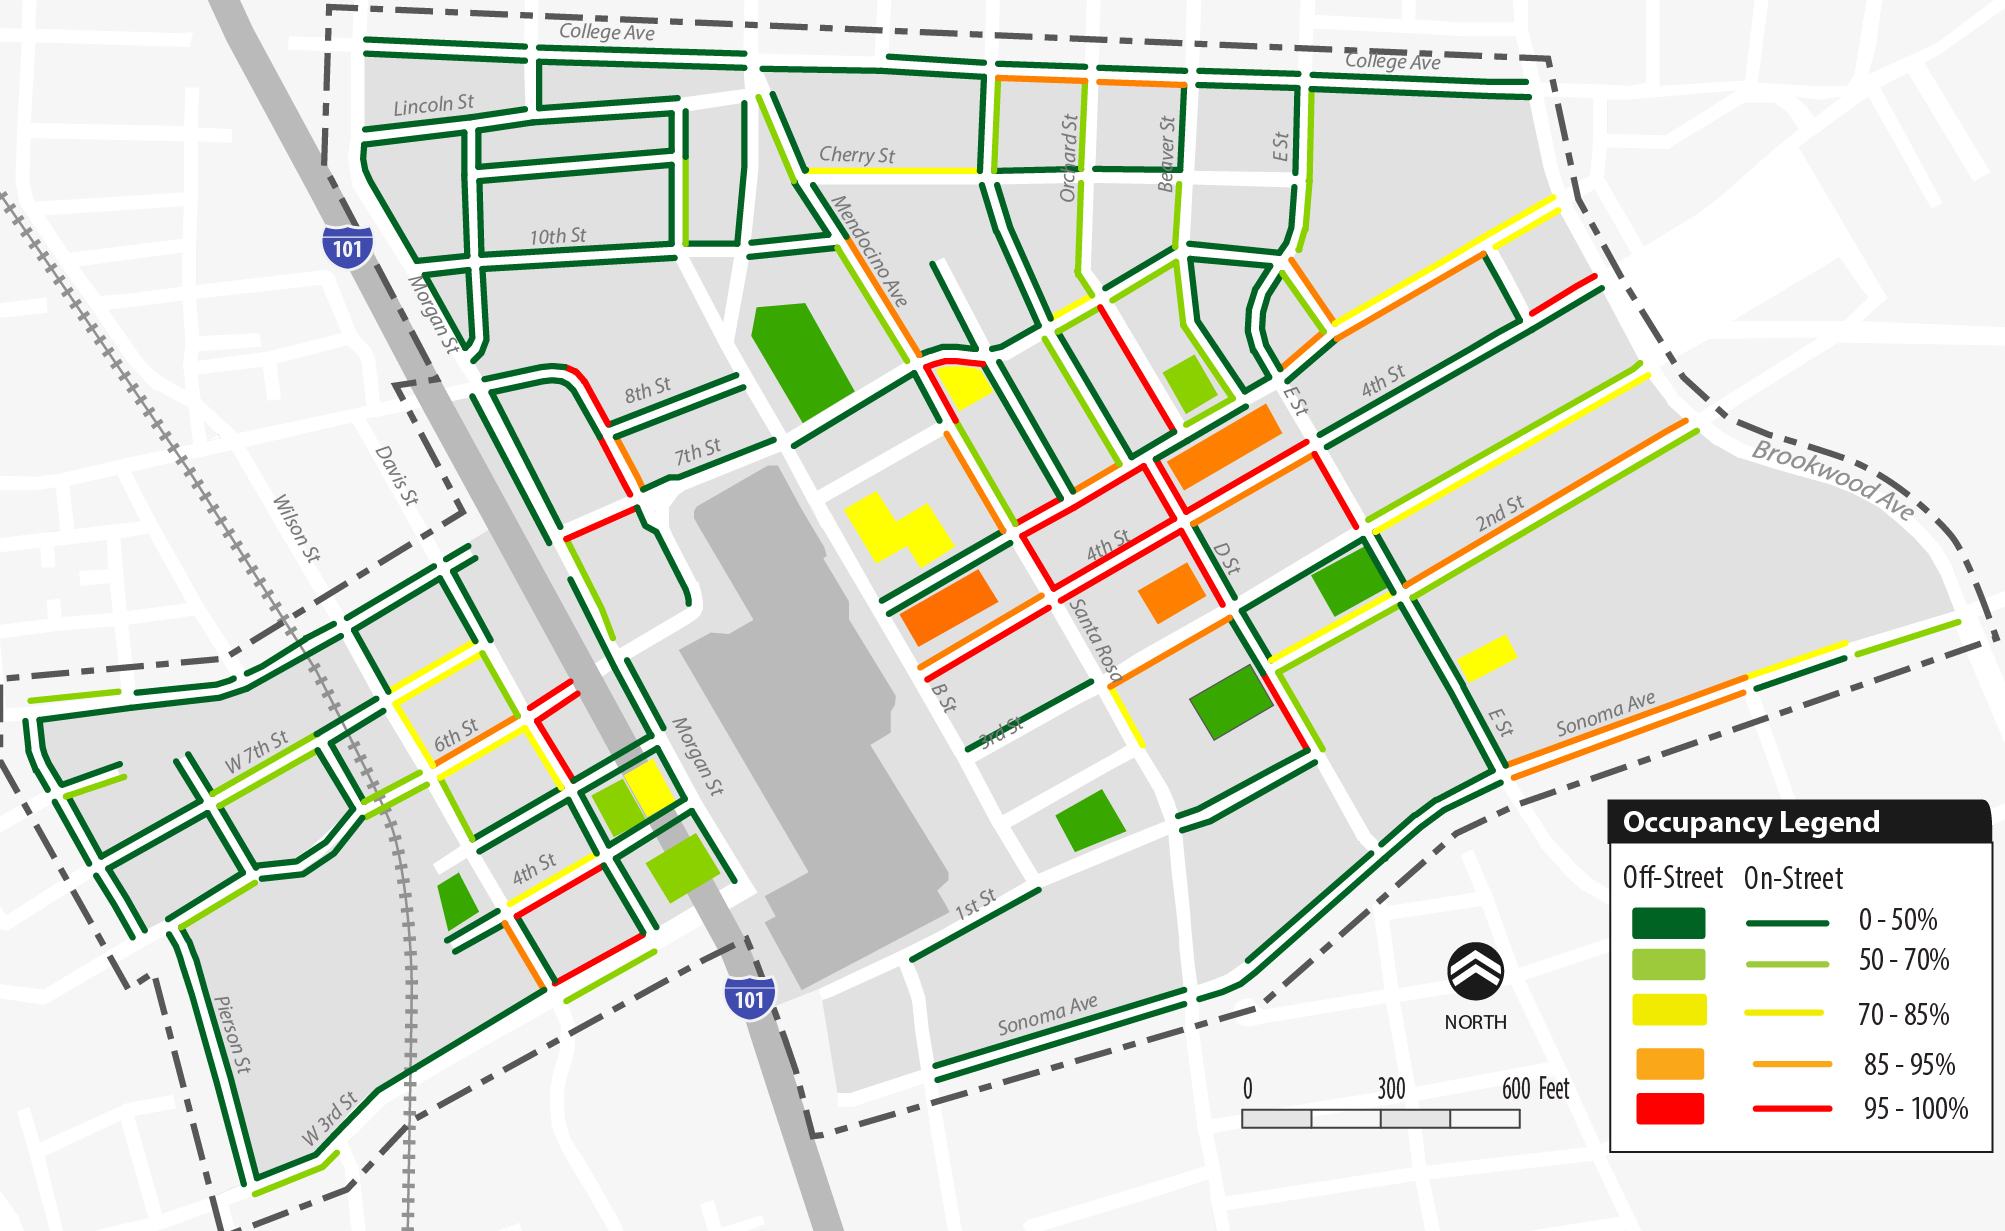
The data collection for this project that is used to address this question includes parking inventory and occupancy for 25 study areas. Inventory (including price and restrictions) and occupancy of public parking (on- and off-street) for one (1) weekday (Monday-Thursday) and one (1) weekend (Saturday) during five (5) times of the day: 5AM, 9AM, 12PM, 4PM, and 8PM. The results are also discussed in relationship to the parking policies within each study area.
Background & Research
Literature Review:
Parking Supply, Demand and Pricing
Professor Donald Shoup, an expert on parking economics, suggests keeping prices consistent with an occupancy level of approximately 85% in order to realize the “right price” for parking.[2] “Underpriced and overcrowded curb parking creates problems for everyone except a few lucky drivers who find a cheap space,” Shoup explains in the introduction to his research on demand based pricing in San Francisco (2013). Additionally, while underpricing and overcrowding creates problems, overpricing and under-crowded spaces also have negative effects.
For areas with more supply than demand, unused parking spaces could be converted to more efficient land uses (such as developments, public space, or parklets); excess (underutilized) parking in these areas could also be used by adjacent high-demand areas by implementing shared parking policies or valet parking policies (see Policy Question #7-11 for application descriptions). Additional literature relating to this balancing of supply, demand through pricing policies include:
- SFPark, goBerkeley, and New York City’s Variable Pricing Pilot projects: each of these projects, explained in detail below, include cutting-edge research on managing on-street parking with variable pricing.
- Transpo Group (2013). Seattle Annual Paid Parking Occupancy Report 2013. Prepared for the Seattle Department of Transportation: This study looks at parking conditions where parking pricing is in effect. Occupancy varies by time of day for different locations with different prices and enforcement policies in place.
- Auchincloss et al. (2014). Public Parking Fees and Fines: A Survey of U.S. Cities. Published in Public Works Management & Policy: This study looks at parking prices within 107 U.S. cities and finds that higher parking costs are associated with an increase in public transit use and less personal automobile demand.
- Robert Cervero’s (2009) study in California found an 11% decrease in parking demand for every 50% reduction in supply.
- GreenTrip Parking Database: the online database pulls information from multi-family residential sites around the San Francisco Bay Area and provides potential developers with completed project figures to see actual parking used for household in a particular location, within a certain type of residence, or at a site with specific traffic reduction strategies.
Price Elasticity of Demand
Several studies have researched how parking prices change demand, calculating price elasticity of demand for different regions. The change in demand due to changes in price is also dependent on supply. Because of this, effects of changes in price on demand are very location-specific. Price elasticity of demand found in cities around the world range from -0.15 to -0.58 from a variety of research, including:
- Kelly and Clinch (2009): A study in Dublin, Ireland found an average price elasticity of demand of -0.29.
- Dueker, et al (1998): A study in Portland found a 5.8% decrease in demand per 10% increase in price using an $80/month base charge (elasticity of -0.58).
- Shoup (1994): Study found a 1.5% decrease in demand per 10% increase in price (elasticity of -0.15).
- Pierce and Shoup (2013): An SFPark study found an average price elasticity of demand of -0.40. Additionally, Millard-Ball, Weinberger, and Hampshire (2014)[3] look at the impacts of SFPark’s pricing research, detailed further within the discussion for Policy Question #7.
Best Practice Applications
Variable Pricing
Policy Application: New York City’s Variable Pricing Pilot
New York City received an FHWA grant to implement demand-based variable pricing. The conditions that led to the program’s initiation were a high rate of cruising for parking, low availability of parking during peak demand periods, and a high rate of double parking. Within Greenwich Village, pricing was raised from $1 to $2 during the peak demand period from noon to 4pm. Occupancy on weekdays decreased about 8% on weekdays and vehicle turnover increased, allowing a higher number of total vehicles to park. Results of the 6-month pilot were well documented and success of the program resulted in continuing the variable pricing policy, raising the fees to $2/hour off-peak and $3/hour during peak periods.
Policy Application: Berkeley’s goBerkeley Pilot
In 2013, with funding from the Federal Highway Administration (FHWA), the City of Berkeley initiated a three-year pilot program that implemented several on-street dynamic pricing strategies to improve day-to-day travel in Downtown Berkeley, Telegraph/Southside and The Elmwood. [4] Hourly rates for on-street parking range from $1.00 to $2.25; prices were set based on the demand for parking in the area. In Berkeley’s Elmwood District, a popular commercial corridor with limited on-street parking, a tiered-parking strategy was implemented to encourage short-term parking and discourage longer-term parking. Prices start at $1.00 and increase $0.50 for every additional hour of stay, up to three hours. In the chosen areas, premium and value areas were established. The higher demand premium areas had shorter time limits and higher hourly rates to encourage turnover, and lower demand value areas had longer time limits and lower hourly rates.
Off-street lots are commonly priced higher than on-street parking, resulting in underutilized off-street parking and excess demand (including double parking) within on-street parking in high demand areas. Off-street parking typically needs to be less expensive to encourage longer term parking, increasing availability of on-street parking for short-term parking. In 2013, Berkeley found that the $0.50/hour higher cost for on-street parking (at $1.50/hour) compared to off-street costs (at $1.00/hour) was not sufficient to encourage parkers to use off-street facilities over on-street facilities. Even with this price differential, on-street parking was still consistently above 85% occupied while off-street facilities were before 75% occupied. This study resulted in recommendations that the pilot implement addition pricing measures to make off-street parking more competitive with on-street parking.[5]
Policy Application: SFpark’s Demand-Based Pricing
With funding from the FHWA in 2011, San Francisco began an ambitious program to set on-street parking prices at variable levels dependent on the demand for that area. Seven pilot zones were selected to have demand-based pricing, with prices adjusted every few weeks based on occupancy rates. For example, if occupancy rates are below 30%, the price is decreased by 50 cents per hour; if occupancy is above 80%, the price is increased 25 cents per hour (Figure below).
Figure: Weekday Morning Prices at Fisherman’s Wharf[6]

There are several benefits of the SFpark program. First, vehicles spend less time circling for parking. This reduces traffic congestion and decreases emissions from excess driving. Second, drivers parked in the areas of higher demand will typically park for a shorter time, increasing turnover rate and therefore, making these spaces available to accommodate more people. Last, more people may use alternative modes and carpool to highly demanded destinations with the highest prices, such as baseball games at AT&T Park.
Pierce and Shoup (2013) calculated the price elasticity of demand based on SFPark data of 5,294 changes in price and occupancy within San Francisco. Overall, over the course of the study, meter prices did not increase overall—meters were adjusted both up and down with the average meter price falling 1%. The average elasticity value calculated was -0.4. Therefore, as the cost for parking increased by $1, occupancy fell by 40%. In other words, on a street block-face with 10 spaces, raising the price by 25 cents will open up one parking space.
After the program had been in effect for six months, Pierce and Shoup (2013) looked at two of the seven pilot areas to calculate the price elasticity of demand based on SFPark’s data showing price and occupancy changes in 2012. The study found that the price elasticity of demand in an area at Fisherman’s wharf was -1.3. Here, demand for parking was low (average occupancy at 27%) and prices were decreased to reach higher occupancies. For every $1 decrease in price per hour, occupancy increased 130% (Table below). Even though per-hour prices decreased, the parking revenue for the Beach Street area increased, because occupancy increased substantially.
Table: Price and Demand Changes for Two SFPark Study Areas
| Area | Change in Price | Change in Occupancy | Price Elasticity of Demand |
| 600 block area near Beach Street at Fisherman’s Wharf | -53%
$3/hr to $1.75/hr |
+70%
27% to 56% occupied |
-1.3 |
| 200 block area at and near Drumm Street | +25%
$3.50/hr to $4.50/hr |
-13%
98% to 86% occupied |
-0.5 |
Regional Parking Database Data Analysis
Data was collected for 25 sites in the Bay Area to look at parking supply, occupancy, and pricing. This information was mapped and analyzed for each city, with recommendations relating to the type of parking concerns each city has. The restrictions for each study area was compared to the parking occupancy, by time of day and day of week. The Maps and Data section shows the full analysis for each of these cities.
Where is local parking supply greater than demand and where is local demand greater than supply?
In most study areas, there is enough supply to support demand. Hot spots exist within some of these locations, where high demand in a relatively small area could be distributed with proper demand management policies. In several sites, supply was much greater than demand. The table below lists each site, the peak off-street occupancy, the peak on-street occupancy, and the total peak occupancy. Table 3 also highlights study areas with particularly low (below 50%) or high (above 75%) peak occupancy. Some study areas have both high very demand and very low demand for their peak periods, depending on the type of parking. Several of these study areas have commuter lots (BART or Caltrain) that have high demand during the midday. Study areas with large discrepancies between on- and off-street parking are in high need of demand distribution policies.
Table: Pricing Summary for each Study Area
| Study Area | ||||
| Alameda Park Street Downtown | 98% | 89% | 90% | Demand is high relative to supply. |
| Albany San Pablo Avenue | 59% | 59% | ||
| Albany Solano Avenue | 58% | 58% | ||
| Burlingame Caltrain Station Area | 83% | 72% | 79% | |
| Dublin BART Station Area | 45% | 40% | 45% | Demand is low relatively to supply. |
| El Cerrito del Norte | 98% | 50% | 71% | |
| El Cerrito Plaza | 98% | 50% | 61% | |
| Emeryville Shopping District | 90% | 83% | 86% | Demand is high relative to supply. |
| Fairfield Downtown and Amtrak | 76% | 36% | 48% | Demand is low relatively to supply. |
| Gilroy Downtown and Amtrak | 50% | 44% | 47% | Demand is low relatively to supply. |
| Hayward Downtown and BART Station Area | 72% | 47% | 70% | |
| Lafayette Mt Diablo Boulevard | 88% | 35% | 63% | |
| Martinez Downtown | 52% | 54% | 53% | |
| Millbrae El Camino Real | 79% | 59% | 63% | |
| Pinole Downtown | 65% | 33% | 39% | Demand is low relatively to supply. |
| San Jose North Downtown | 73% | 77% | 65% | |
| San Jose South Downtown | 52% | 52% | 52% | |
| San Jose Diridon Station Area | 50% | 50% | ||
| San Jose Northeast Downtown | 29% | 57% | 39% | Demand is low relatively to supply. |
| Santa Rosa Downtown* | 47% | 43% | 46% | *While Downtown demand is high, residential demand is low relatively to supply. |
| Sausalito Waterfront | 96% | 74% | 83% | Demand is high relative to supply. |
| South San Francisco Downtown | 54% | 82% | 78% | |
| Sunnyvale Downtown and Caltrain Station Area | 52% | 52% | 52% | |
| Union City Downtown and BART Station Area | 81% | 40% | 58% | |
| Vallejo Downtown and Waterfront | 70% | 39% | 54% |
Note: Green represents occupancy below 50%; orange represents occupancy between 75% and 85%; red represents occupancy above 85%
What prices for parking does this hold?
Pricing was analyzed for each of the 25 parking analysis sites. 11 of the 25 sites have no pricing, except for BART facilities. On-street prices range typically range from $0.50-$2.00/hour. Off-street prices often are higher, despite lower off-street demand in these areas (e.g. San Jose, South San Francisco, and Vallejo). Cities with on-street pricing have an average peak on-street occupancy of 60%, while cities without on-street pricing have an average peak on-street occupancy of 50%. While areas with on-street pricing typically have higher occupancy,
Table 4 summarizes the pricing policies for each city. Maps and Data section shows detailed maps and analysis for each individual study area.
Table 4: Pricing Summary for each Study Area
| Study Area | Pricing Summary |
| Alameda Park Street Downtown | On-street pricing varies from $1.00 – $1.50/hour throughout Alameda; Prices are $1.50 in the Park Street business district and $1.00 around Webster Street; no off-street pricing. |
| Albany San Pablo Avenue | No on-street or off-street pricing. |
| Albany Solano Avenue | No on-street or off-street pricing. |
| Burlingame Caltrain Station Area | On-street pricing includes $1.00/hour on Howard Ave from Primrose Rd to Highland Ave, $1.00 first hour/$2.00 second hour on Burlingame Avenue, and $2.00 for 2 hours. Off-street pricing includes $1.00 first hour/$2.00 second hour or $3.00 for 10 hours for other facilities. |
| Dublin BART Station Area | No on-street or off-street pricing. |
| El Cerrito del Norte | Off-street pricing at $1.00-$3.00/day |
| El Cerrito Plaza | No on-street pricing; $3.00 daily fee at El Cerrito BART parking. |
| Emeryville Shopping District | No on-street or off-street pricing. |
| Fairfield Downtown and Amtrak | No on-street or off-street pricing. |
| Gilroy Downtown and Amtrak | No on-street or off-street pricing. |
| Hayward Downtown and BART Station Area | No on-street or off-street pricing at public facilities. Recent implementation of BART pricing after time of data collection (2015). |
| Lafayette Mt Diablo Boulevard | On-street pricing at $1.00/hr. |
| Martinez Downtown | On-street pricing at $0.50/hr |
| Millbrae El Camino Real | No on-street or off-street pricing. |
| Pinole Downtown | No on-street or off-street pricing. |
| San Jose North Downtown | San Jose parking meters charge $2 per hour in the downtown core (except multi-space meters) and $1 per hour outside the downtown core. Multi-space meters charge $2 on weekdays near Diridon Station and special pricing during events or near the Convention Center. Off-street pricing at $1.00 for 20 min/$20 max weekends $5.00 flat fee. |
| San Jose South Downtown | |
| San Jose Diridon Station Area | |
| San Jose Northeast Downtown | |
| Santa Rosa Downtown | $1.00/hr pricing both on-street and off-street. |
| Sausalito Waterfront | On-street pricing $1.00/hr; $1-3/hour off-street pricing with $5-25 daily max prices. |
| South San Francisco Downtown | On-street pricing ranges from $0.75-$1.00/hr. Off-street pricing ranges from $0.75-$3.00/hour and includes daily permit. |
| Sunnyvale Downtown and Caltrain Station Area | No on-street or off-street pricing. |
| Union City Downtown and BART Station Area | On-street pricing at $0.50/hr. Off-street pricing ranges from $2.50-$3.00/hr. |
| Vallejo Downtown and Waterfront | No on-street pricing; some off-street pricing at $5.00 daily fees and/or $20 monthly passes. |
Challenges
What (if any) impediments inhibit our ability to answer the question entirely?
There are several impediments to data collection and analysis that inhibit our ability to answer this question entirely.
- Due to limited resources, data collection is limited to 25 new sites, rather than being able to collect data throughout the Bay Area. Locations are biased towards areas with high demand as well as areas where transit-accessible areas. These limit the generalizability of the findings from the specific locations.
- Data collection was completed between August 2014 and February 2015. Therefore, data collection did not occur for all time periods or all seasons, limiting the generalizability of the findings to a few representative times.
- It is challenging to collect supply and use data for private off street parking; in some places this type of parking is a major component of the total parking supply and this gap should be recognized in the development of findings. While some collections do include some private off-street facilities, most collections include only on-street and public off-street facilities.
Potential Policy Actions
-

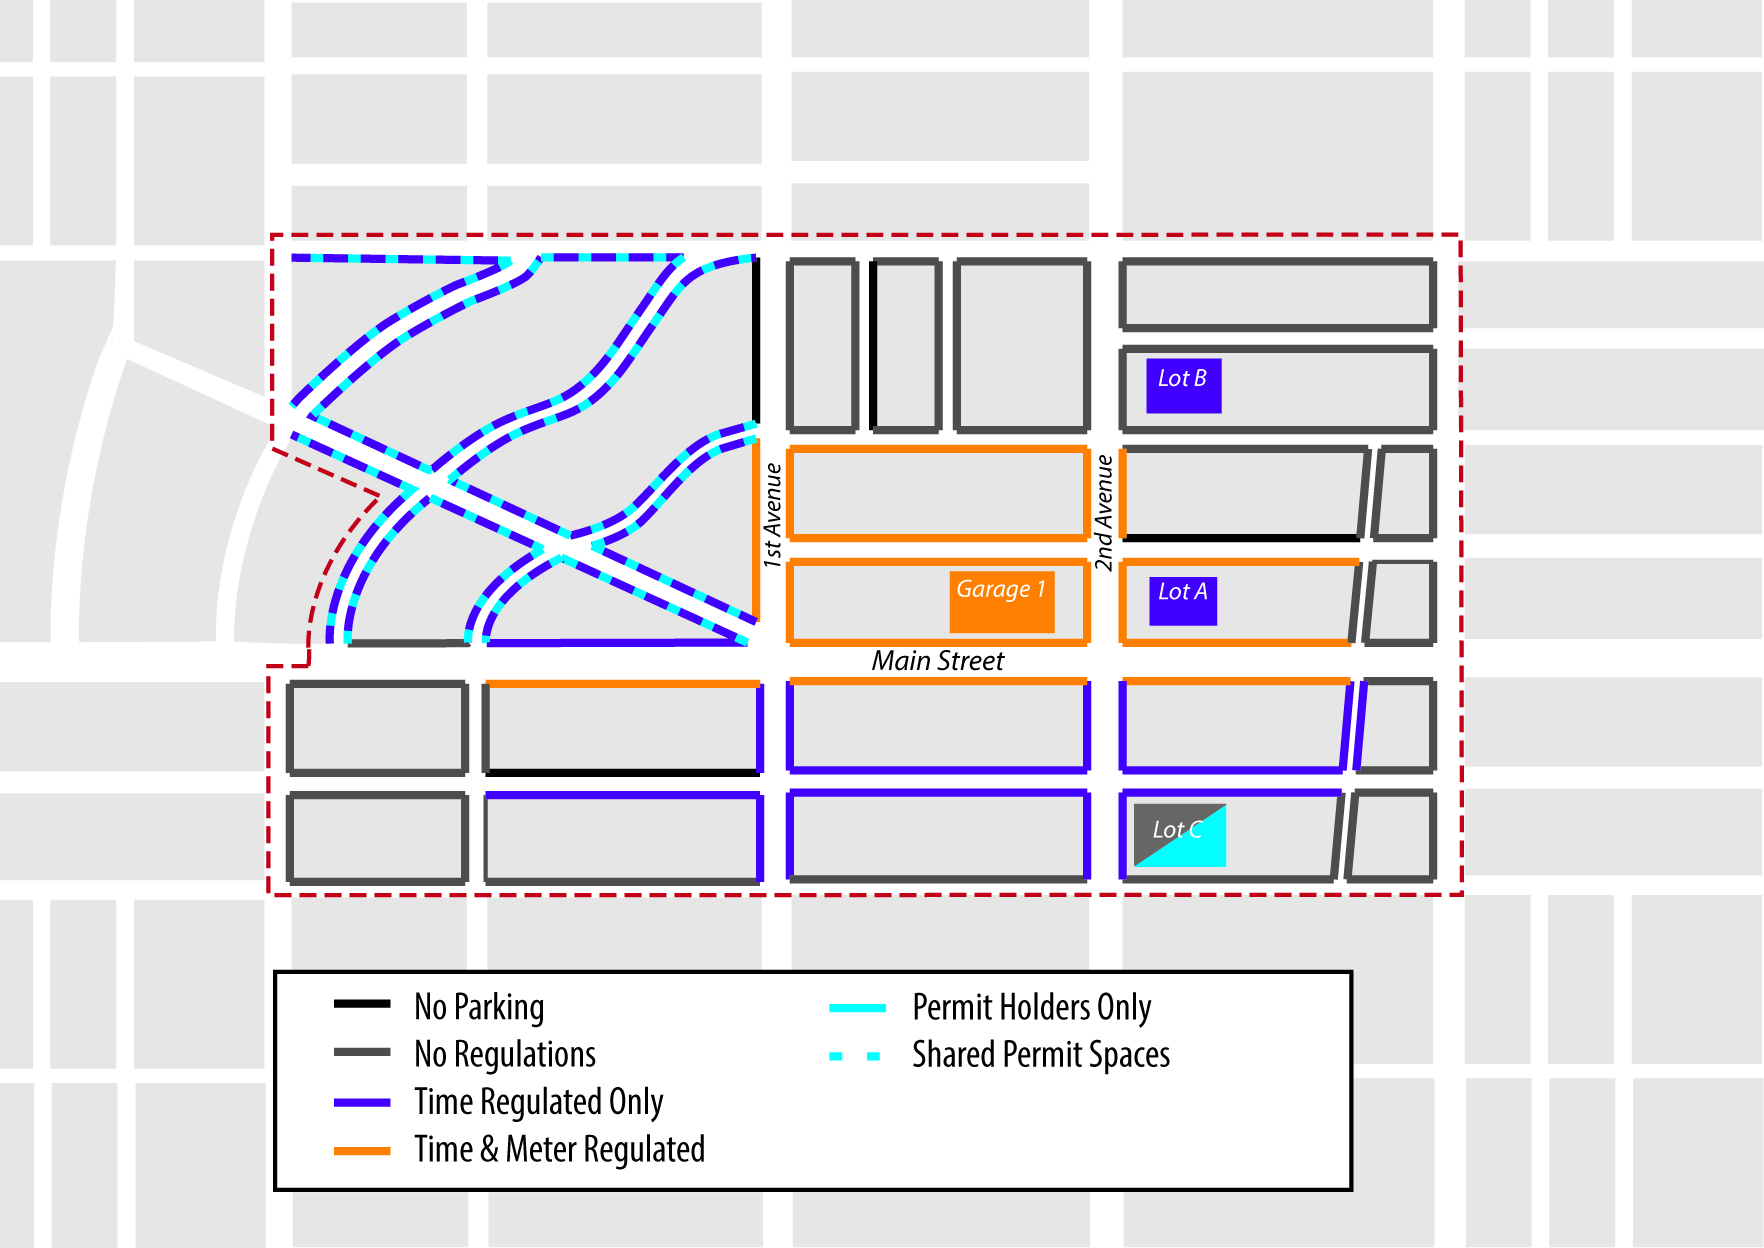
Figure: Example of a map of parking requirements, used to correlate with parking demand.
Supporting additional analyses of local conditions (tied in with the new parking database) and supporting implementation of better parking policies through performance pricing using smart meters, information systems, etc (Figure).
- Using available data and high-level recommendations to craft responsive policies to improve parking demand management.
[1] Analysis will also utilize data from study areas with current (since 2010) data where available.
[2] Some of the most relevant and recent publications include by Donald Shoup include: Donald Shoup, “Cruising for Parking,” Transport Policy, Vol. 13, No. 6, November 2006, pp.479–486; Gregory Pierce and Donald Shoup, “Getting the Prices Right: An Evaluation of Pricing Parking by Demand in San Francisco,” Journal of the American Planning Association, Vol. 79, No. 1, Winter 2013, pp. 67–81; Donald Shoup, The High Cost of Free Parking, Chicago: Planners Press, 2005 and revised 2011.
[3] Is the Curb 80% full or 20% empty? Assessing the Impacts of San Francisco’s Parking Pricing Experiment. Transportation Research Part A: Policy and Practice.
[4] GoBerkeley. Available at: http://www.GoBerkeley.info
[5] Memo to the Honorable Mayor and Members of the City Council from Christine Daniel, City Manager. October 29, 2013. City of Berkeley. Re: Enable Off-Street Parking Rate Changes in goBerkeley Pilot Program.
[6] Access Magazine. SFpark: Pricing Parking by Demand. Available at: http://www.uctc.net/access/43/access43_sf_park.shtml
